Why Your Readmission Model Is Blind — And What 200 Federal Health Variables Can Show You
Every hospital in America has a readmission model. And almost every one of them is blind.
Here's what I mean. Your current model pulls data from the EHR — diagnoses, vitals, medications, length of stay, prior admissions. It runs a logistic regression or maybe a random forest. It spits out a risk score. And your care team uses that score to decide who gets a follow-up call and who doesn't.
The problem? That model has no idea where the patient is going home to.
It doesn't know the patient lives in a food desert. It doesn't know there's no pharmacy within 8 miles. It doesn't know the building has no air conditioning and the neighborhood sits in a CDC-designated extreme heat zone. It doesn't know the nearest bus stop is a 40-minute walk, which means the patient will miss their follow-up appointment, which means they'll end up back in your ER within 30 days.
Those aren't clinical factors. They're geographic ones. And they're invisible to every EHR-based readmission model on the market.
The penalty math is getting worse, not better
CMS just increased HRRP penalties for the first time in five years. Starting FY 2027, Medicare Advantage patients will be included in readmission cohorts — a change projected to push 75-82% of hospitals into penalty territory. That's not a niche problem. That's nearly every hospital in the country losing money on readmissions.
The TEAM mandate, which went into effect January 2026, adds another layer: 714 hospitals now bear financial accountability for 30-day post-surgical outcomes across five episode types. Every readmission during that window directly hits reimbursement.
Hospital CEOs are responding exactly how you'd expect. UC San Diego Health's CEO said publicly that they're "ultra focused" on readmission scores and patient flow in 2026. Southern New Hampshire Health's CEO pointed to community placement — "not being able to place patients in the community" — as the key bottleneck.
They're asking the right question: why do patients keep coming back?
But they don't have the right tool to answer it.
The SVI trap
Most hospitals that try to incorporate social determinants use the CDC's Social Vulnerability Index. SVI is a good start. It tells you a census tract is "vulnerable." But it's a blunt instrument.
A census tract might score critically high on SVI because of poverty and language barriers — not because of any respiratory disease burden. If your pulmonology service line is trying to decide where to deploy a mobile asthma clinic, SVI alone will send you to the wrong neighborhood. That's a multi-million dollar strategic miss.
What you actually need is the ability to ask: "Show me the specific census tracts where asthma prevalence is high AND the population skews elderly AND there's no hospital within 15 miles AND health insurance coverage is below average."
That's not one variable. That's four variables, from three different federal datasets, with a negative weight on hospital proximity. SVI can't do that. Your EHR can't do that. Your GIS team could do it — in about six weeks.
What happens when you combine 200+ health variables in 10 seconds
We built something at Variate Health that I haven't seen anywhere else.
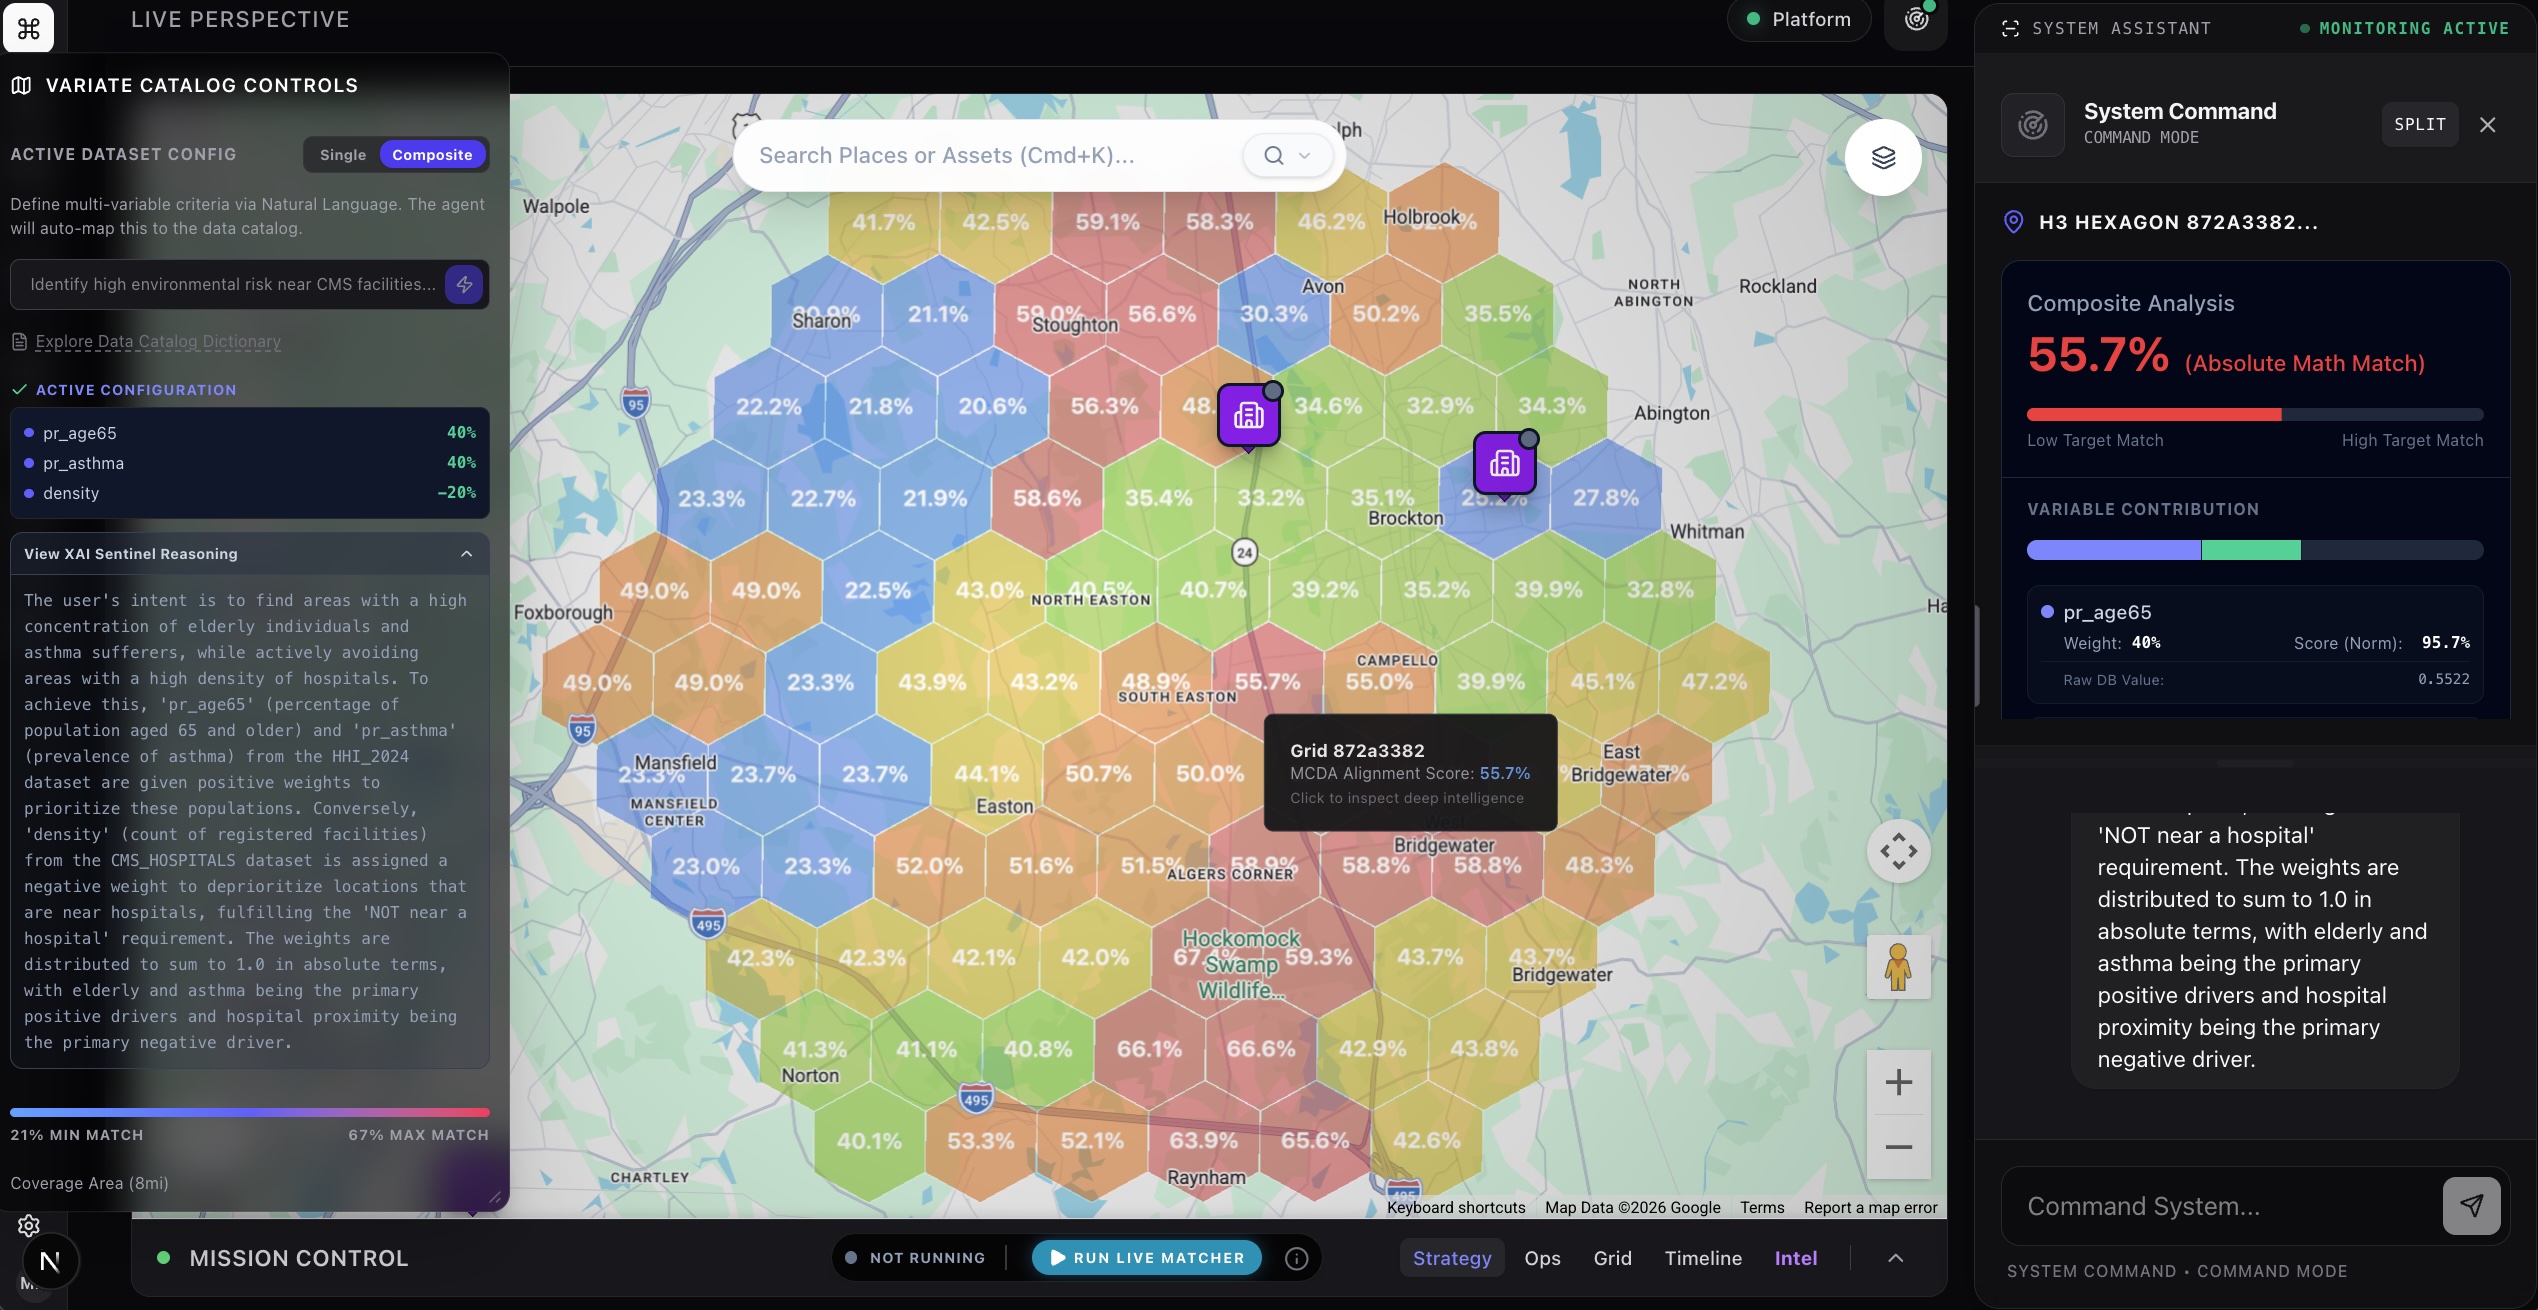
Our MCDA Precision Epidemiology Engine lets you type a question in plain English — "Find areas with high diabetes prevalence among the elderly that lack nearby hospital access" — and the AI scans 200+ variables across CDC PLACES, the Health and Heat Index, the Social Vulnerability Index, the Environmental Justice Index, and CMS hospital data. It identifies the exact variables that match your intent, assigns mathematically precise weights, normalizes everything to a common scale, and renders a composite heat map on a live interactive map.
In under 10 seconds.
The map shows you the specific geographic zones where those variables converge. Not "this county is red." But "these 14 census tracts in the southeast corner of your service area have the exact convergence of disease burden, social vulnerability, and healthcare access gaps that predicts readmission risk."
And it tells you the estimated number of people affected — not a percentile, not a relative score, but an actual human count. "Approximately 4,200 people aged 65+ in this zone meet the composite risk criteria."
From readmission prediction to readmission prevention
Here's where it connects back to your readmission problem.
When a patient is discharged, their ZIP code tells a story that the EHR never captures. Layer that ZIP code against the MCDA engine's composite of social vulnerability, disease prevalence, environmental risk, and healthcare access — and you know, within seconds, whether that patient is going home to a high-risk zone.
Patients discharged into high-composite-risk zones get automatically flagged for proactive follow-up routing. Your care team doesn't have to guess who needs the post-discharge call. The geography tells them.
The average readmission costs $15,200. If this approach identifies even 20 high-risk discharges per month that would have bounced back without intervention, that's $3.6 million in avoided penalties and costs annually.
The question every hospital board should be asking
Your readmission model uses 20-30 clinical variables from inside the hospital. There are 200+ health, social, and environmental variables available from federal sources that describe what's happening outside the hospital — where the patient actually lives.
You're making multi-million dollar decisions with half the picture.
The technology to combine these variables in real time, at the census-tract level, using natural language, now exists. The question is whether you'll use it before your competitors do — and before CMS expands the penalty net again.
If you want to see your service area through this lens, we'll show you — live — in 30 minutes.
Schedule a Technical Assessment Now - click here
Mike Mack is the founder and CEO of Variate Health, an AI-powered geospatial intelligence platform for healthcare. He previously built geospatial analytics platforms for large organizations used by Walgreens, Rite Aid, City of Hope, and multiple TeleHealth and At-Home orgs.


